Machine Learning Application —— Photo OCR
Because Ghost Blog’s LaTeX recognition syntax differs from standard LaTeX syntax, the LaTeX formulas in the following article may appear garbled for the sake of broader compatibility. If that happens, and if you don’t mind, you can read the non-garbled version of this article on the author’s GitHub. The author will fix this garbling issue when time permits. Thank you for your understanding.
GitHub Repo: Halfrost-Field
Follow: halfrost · GitHub
Source: https://github.com/halfrost/Halfrost-Field/blob/master/contents/Machine_Learning/Application_Photo_OCR.ipynb
I. Photo OCR
1. Problem Description and Pipeline
What an image text recognition application does is recognize text from a given image. This is much more complex than recognizing text from a scanned document.
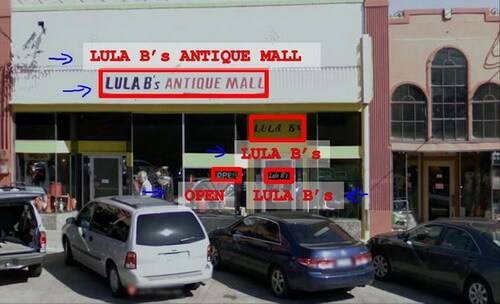
To accomplish this, the following steps are required:
Text detection — separate the text in the image from other objects in the environment Character segmentation — split the text into individual characters Character classification — determine what each character is We can express this problem with a task pipeline diagram, where each task can be handled by a separate small team:

2. Sliding Windows
Sliding windows are a technique used to extract objects from images. Suppose we need to recognize pedestrians in an image. The first thing to do is train a model that can accurately recognize pedestrians using many fixed-size images. Then, using the same image size that was used when training the pedestrian recognition model, we crop regions from the image on which we want to perform pedestrian recognition. We feed each cropped patch to the model and let the model determine whether it contains a pedestrian. Then we slide the cropping region across the image and crop again, feed the newly cropped patch to the model for prediction, and repeat this process until the entire image has been checked.
Once that is done, we scale up the cropping region proportionally, crop the image again at the new size, scale the newly cropped patches down to the size accepted by the model, and feed them to the model for prediction. We repeat this process as well.
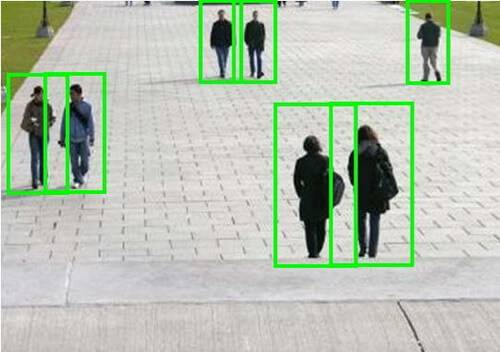
The sliding window technique is also used for text recognition. First, we train a model that can distinguish characters from non-characters. Then we apply the sliding window technique to recognize characters. Once character recognition is complete, we expand the detected regions somewhat, and then merge overlapping regions. Next, we use the aspect ratio as a filtering condition to filter out regions whose height is greater than their width (assuming that words are typically longer than they are tall). In the figure below, the green regions are the regions considered to be text after these steps, while the red regions are ignored.
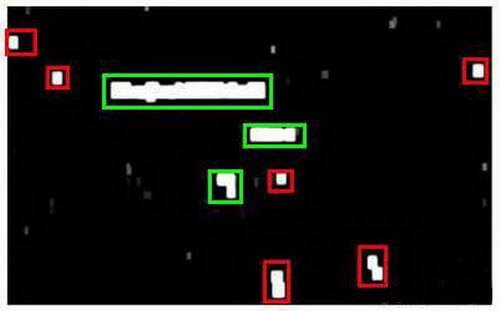
The above is the text detection stage. The next step is to train a model to split text into individual characters. The required training set consists of images of single characters and images of the gaps between two adjacent characters.
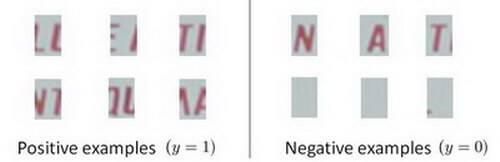
After the model is trained, we still use the sliding window technique to perform character recognition.
The above is the character segmentation stage. The final stage is character classification, for which we can train a classifier using a neural network, support vector machine, or logistic regression algorithm.
3. Getting Lots of Data and Artificial Data
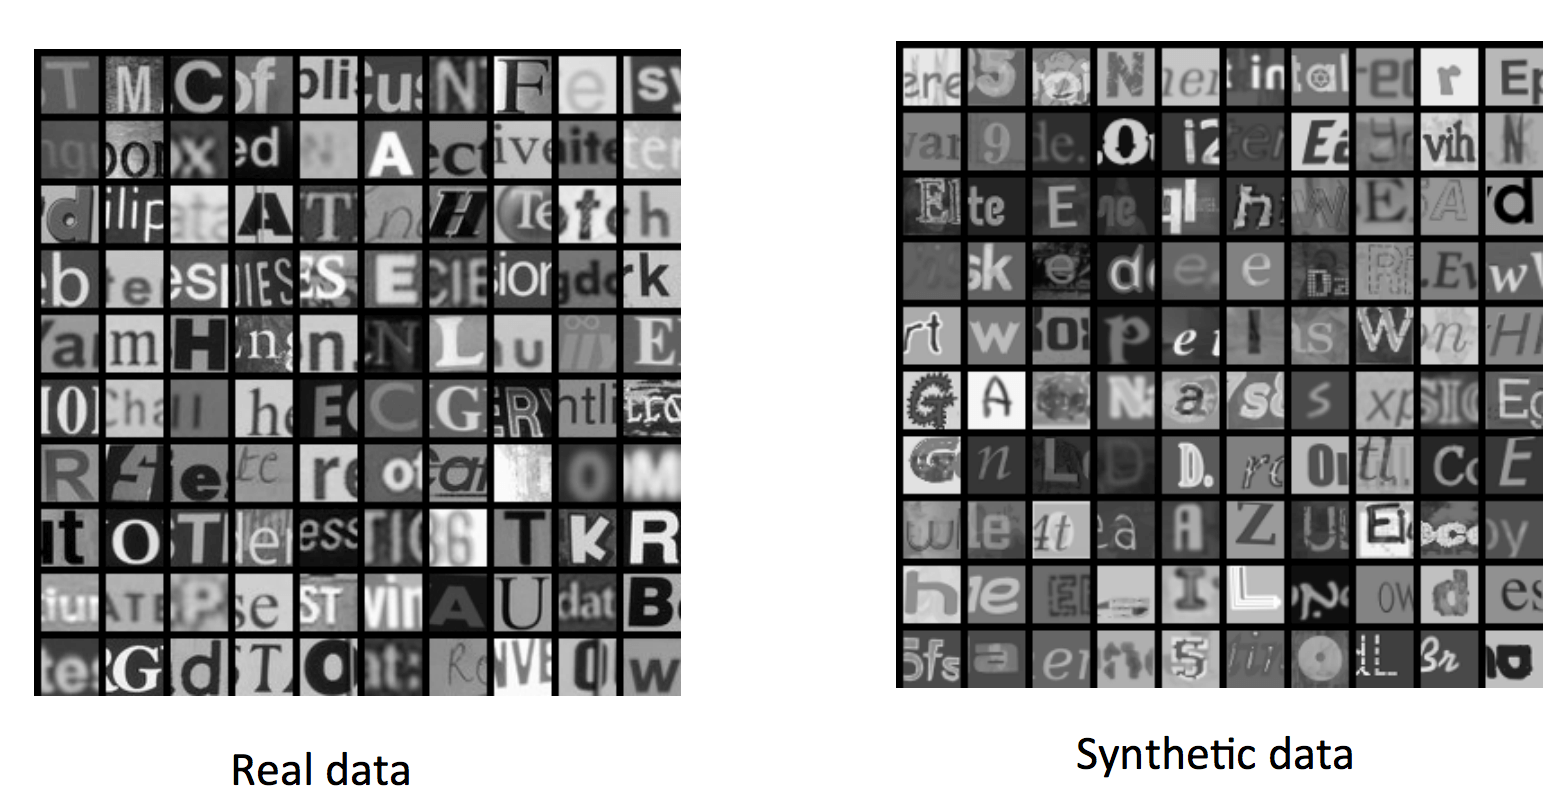
In the character recognition stage, to better perform the classification and recognition task, we need to provide the system with as many training images as possible. If we do not have many images on hand, we need to synthesize more data artificially. For example, we can collect different fonts and add a random background to each character in each font, thereby artificially expanding the set of character images substantially:
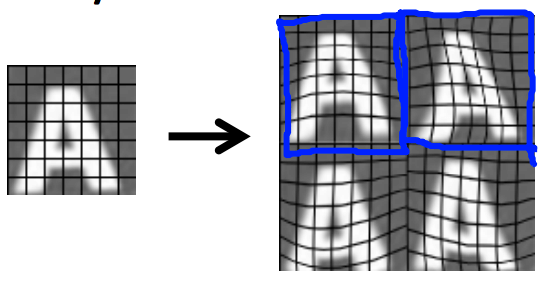
In addition, new data can also be synthesized by distorting character shapes. This will also help the machine better handle images whose shapes have changed:
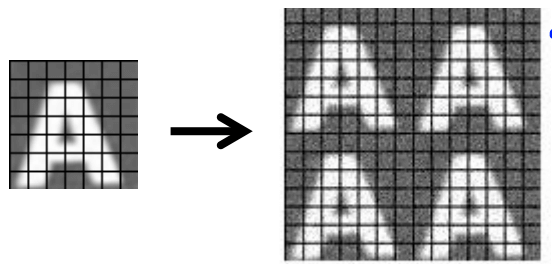
However, adding random noise to data generally does not improve the quality of model training:
4. Ceiling Analysis
In machine learning applications, we often need to go through several steps before making the final prediction. How can we know which part is most worth spending time and effort improving? This question can be answered through ceiling analysis.
Returning to our text recognition application, the pipeline is as follows:
Ceiling analysis means assuming that a component and all components before it have reached 100% accuracy—that is, the component performs its task perfectly and reaches its ceiling—and then measuring how much the accuracy of the entire system improves. For example, suppose the overall system accuracy is 72%. We set the text detection accuracy to 100% (for example, manually locating the text boxes in the image using Photoshop). At this point, the overall system accuracy can improve to 89%. In other words, if we put enough effort into optimizing text detection, then in the ideal case, we can improve the system accuracy by 17%:
| Component | Pipeline Accuracy | Accuracy Improvement |
|---|---|---|
| Entire system | 72% | – |
| Text detection | 89% | 17% |
| Character segmentation | 90% | 1% |
| Character recognition | 100% | 10% |
After completing the ceiling analysis, we obtain the table above. We can see that the step most worth spending effort on is text detection, while the least worthwhile step is character segmentation. Even if we achieved 100% segmentation, it would improve the system by at most 1%.
II. Application: Photo OCR Quiz
1. Question 1
Suppose you are running a sliding window detector to find text in images. Your input images are 1000x1000 pixels. You will run your sliding windows detector at two scales, 10x10 and 20x20 (i.e., you will run your classifier on lots of 10x10 patches to decide if they contain text or not; and also on lots of 20x20 patches), and you will “step” your detector by 2 pixels each time. About how many times will you end up running your classifier on a single 1000x1000 test set image?
A. 500,000
B. 100,000
C. 250,000
D. 1,000,000
Answer: A
$2*500*500 = 500,000$
2. Question 2
Suppose that you just joined a product team that has been developing a machine learning application, using m=1,000 training examples. You discover that you have the option of hiring additional personnel to help collect and label data. You estimate that you would have to pay each of the labellers ¥10 per hour, and that each labeller can label 4 examples per minute. About how much will it cost to hire labellers to label 10,000 new training examples?
A. ¥600
B. ¥400
C. ¥10,000
D. ¥250
Answer: B
One person can label $4*60 = 240 $ examples in one hour. Therefore, it requires $10000 / 240 \approx 40$ hours. At ¥10 per hour, the total is $10*40 = 400$.
3. Question 3
What are the benefits of performing a ceiling analysis? Check all that apply.
A. It can help indicate that certain components of a system might not be worth a significant amount of work improving, because even if it had perfect performance its impact on the overall system may be small.
B. If we have a low-performing component, the ceiling analysis can tell us if that component has a high bias problem or a high variance problem.
C. A ceiling analysis helps us to decide what is the most promising learning algorithm (e.g., logistic regression vs. a neural network vs. an SVM) to apply to a specific component of a machine learning pipeline.
D. It gives us information about which components, if improved, are most likely to have a significant impact on the performance of the final system. Answer: A, D
4. Question 4
Suppose you are building an object classifier, that takes as input an image, and recognizes that image as either containing a car (y=1) or not (y=0). For example, here are a positive example and a negative example:
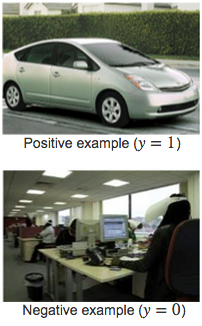
After carefully analyzing the performance of your algorithm, you conclude that you need more positive (y=1) training examples. Which of the following might be a good way to get additional positive examples?
A. Apply translations, distortions, and rotations to the images already in your training set.
B. Select two car images and average them to make a third example.
C. Take a few images from your training set, and add random, gaussian noise to every pixel.
D. Make two copies of each image in the training set; this immediately doubles your training set size.
Answer: A
5. Question 5
Suppose you have a PhotoOCR system, where you have the following pipeline:

You have decided to perform a ceiling analysis on this system, and find the following:
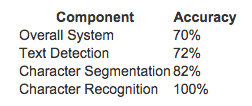
Which of the following statements are true?
A. The potential benefit to having a significantly improved text detection system is small, and thus it may not be worth significant effort trying to improve it.
B. If we conclude that the character recognition’s errors are mostly due to the character recognition system having high variance, then it may be worth significant effort obtaining additional training data for character recognition.
C. We should dedicate significant effort to collecting additional training data for the text detection system.
D. The most promising component to work on is the text detection system, since it has the lowest performance (72%) and thus the biggest potential gain.
Answer: A, B
The improvement from text detection is indeed not significant, so there is no need to provide it with a large amount of additional data. By contrast, if the classifier/recognition component has high variance, then it needs a large amount of data for training. Therefore, C and D are incorrect.
GitHub Repo: Halfrost-Field
Follow: halfrost · GitHub